Customizing Parameters
Contents
Customizing Parameters#
Basic Parameters#

Fill out text here.
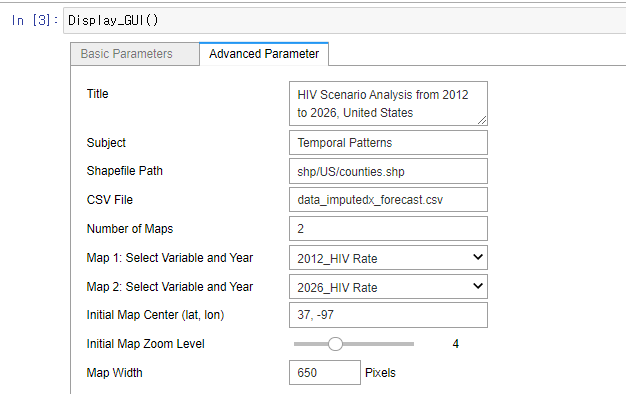
Advanced Parameters#
Parameter |
Description |
|---|---|
|
Title text that would appear in the top of the result visualization file. |
|
|
|
File path of shapefile that would be a base map layer to map visualization. |
|
File path of the CSV file that you want to visualize on the maps. |
|
Number of maps to visualize in the HTML file. |
|
Layers you want to visualize in the maps. |
|
|
|
|
|
|
|
Write full name of variables to make variables names more intuitive. |
Below are chart-specific parameters, for MLC, CLC, and PCP respectively.
Parameter |
Description |
|---|---|
|
For MLC, number of MLC charts. For CLC and PCP, number of lines in a chart. |
|
Path to the documentation, relative to the repository root (e.g. docs/). See [](customize:source-files). |
|
This parameter only applies to MLC. Determine which time period to highlight, and in which color in ‘start time, end time, colorcode’ format (e.g., 2019, 2026, #fdff32). |
|
A Top 10 Chart linked with the right-side map. |
|
Exclude extreme outliers to avoid skewed results. |
